This feature's availability depends on your subscription plan and role.
Definition: A dashboard is a visual display of all of your data. While it can be used in all kinds of different ways, its primary intention is to provide information at-a-glance about the use of your parking lot.
Why should I check out the Dashboards?
Through the dashboard you will be able to see how your parking lot is being used by group of spot and by access types.
This is interesting when you have an event for example or to see which spots are less being used then others or to find a pattern back on what days and what time the parking is being used the most, to determine the amount of credits it will cost for a person to park or to verify there is no overoccupancy because some preferential users dis not release their spots etc.
There are 3 kind of dashboards available:
- Current occupancy (can be downloaded)
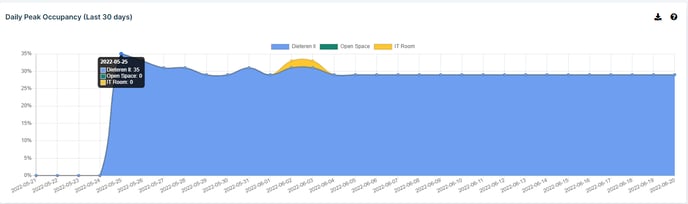
- Daily Peak occupancy (Last 30 days) (can be downloaded)
- Planned occupancy over time
How can I find the dashboard back?
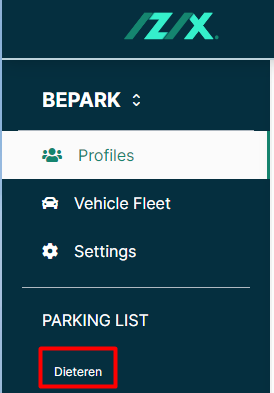
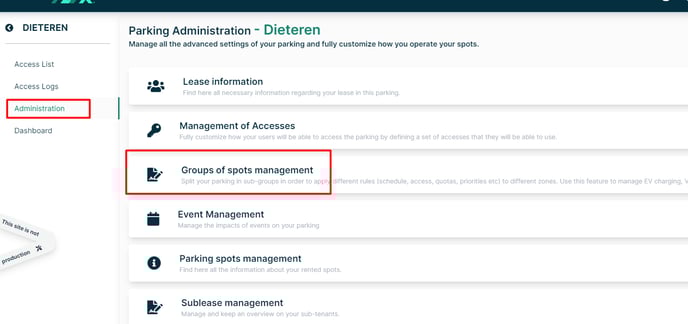
1. Click on the name of your parking lot
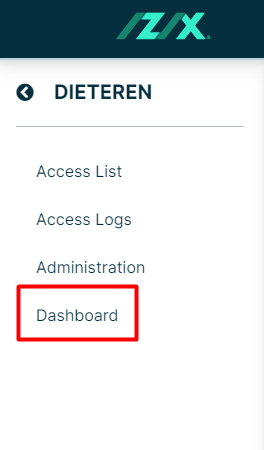
2. Click on "Dashboard"
3. Current Occupancy:
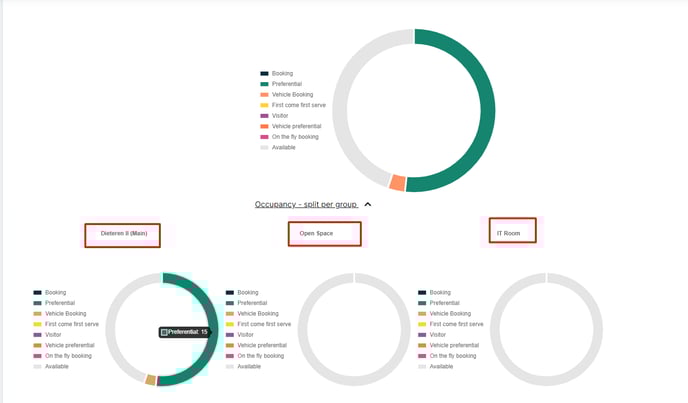
- You can also see the current occupancy per group:
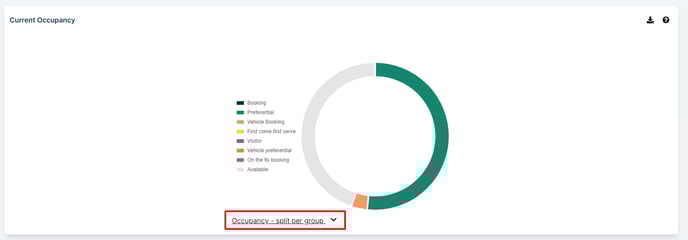
- You can see a graph by group of spot and by color (= Access type)
The group of spots can be set up in here :
- Download the graph by clicking at the right top on this icon
Daily Peak occupancy (Last 30 days):
- Download the graph by clicking ath right top on this icon
Planned occupancy over time:
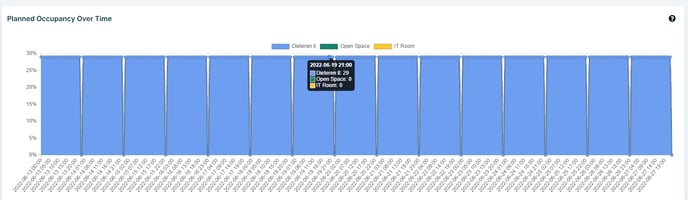
Hover with your cursor over the colors in the chart to see the data behind every access type.
The graphs shows the current occupancy in your parking lot calculated according to your users' parking time slots. It is not directly linked to the counting of entries and exists, for example: if a user has a valid access (Booking, preferential etc.) at this time and day but did not come to the parking lot yet he will be counted as planned and will be represented in the occupancy chart.